Software is, by default, opaque. We can easily see what the output is, but understanding why requires adding instrumentation: metrics, log statements, and other windows into the inner workings of our process. Adding too little instrumentation makes it difficult to detect and respond to problems as they arise. Adding too much obscures the core business logic, making it harder to reason about the code, and easier to introduce errors.
This tradeoff is a critical design consideration in all production services. The API Infrastructure team at Fitbit recently built a frontend server, as described in a talk I gave last month at the Strange Loop conference. Since this process is responsible for validating and routing all incoming traffic for our backend, it was critical that it be as transparent as possible, as incorrect or inefficient behavior would be very costly.
However, we also needed for our process to be stable and fast. On average, our server only spends 0.1 milliseconds processing each request, but we spend at least 100x longer simply waiting for the request to be handled downstream. By minimizing the overhead for each in-flight request, we can ensure that our server is robust to spikes in both upstream request volume and downstream latency.
For this reason, we built our process using Netty, which is a Java framework for asynchronous network communication. This gives us both speed and stability by minimizing the compute and memory overhead of each concurrent request. Unfortunately, this conflicts with our need for transparency, since the flow of each request is broken up into a series of separate actions, connected by callbacks.
Our solution to this problem is called a passport. As the name suggests, a passport contains a collection of stamps, each representing progress in our handling of a given request. Once we are done handling the request we can use the stamps, each of which has an associated time, to generate detailed metrics about that request.
One obvious benefit to this approach is that we regain a coherent narrative thread for each request. A less obvious, but very real, benefit is that it enforces a separation between our metrics and business logic. It provides rich metrics without compromising the simplicity of our code.
While the basics of the passport model are described in the talk, a number of people have reached out in person or via email to ask for more details. This post will provide a more detailed walkthrough.
Step 1: define your states and transitions
Let’s consider an ETL process which performs the following actions:
- Extract a batch of data from database A
- Transform the data
- Load the transformed data into database B
- If there are more batches, repeat
Of course, things can go wrong here. Our requests to the databases may time out or may fail for some other reason. Our transform step may also fail. Taking these into account, our state machine looks something like this:
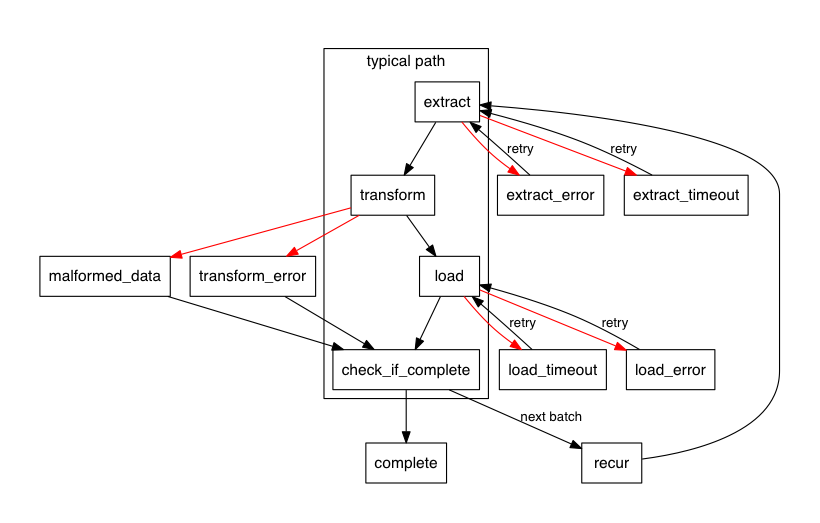
Notice that we call out an explicit failure state for our transform step (“malformed data”), as well as an additional state which covers everything else. Every happy-state needs to have at least one error transition, and it’s useful to have more when there are explicit classes of errors we want to track.
This diagram is generated using Graphviz, using the following syntax:
digraph {

 node [shape=box, fontname=helvetica, fontsize=14]
 edge [fontname=helvetica, fontsize=12]
 rankdir=TB; pad=0.5; dpi=80;

 // happy path
 subgraph cluster_0 {
   color=black; label="typical path"; fontname=helvetica

   extract -> transform -> load -> check_if_complete
 }

 // transform failures
 transform -> malformed_data [color=red]
 transform -> transform_error [color=red]

 // extract failures, and retries
 extract -> extract_error [color=red]
 extract -> extract_timeout [color=red]
 extract_error -> extract [label="retry"]
 extract_timeout -> extract [label="retry"]

 // load failures, and retries
 load -> load_error [color=red]
 load -> load_timeout [color=red]
 load_error -> load [label="retry"]
 load_timeout -> load [label="retry"]

 // skip load step, if transform fails
 transform_error -> check_if_complete
 malformed_data -> check_if_complete

 // recur, if there's more data
 check_if_complete -> complete
 check_if_complete -> recur [label="next batch"]
 recur -> extract
}
This is a simple, informal specification that we can store alongside our code. Of course, it doesn’t affect our actual implementation in any way, so it’s up to us to keep them in sync with each other.
Step 2: implement your passport
Our passport is pretty simple: it’s an enumeration of states, and something which holds tuples of states and timestamps.
public enum State {
 EXTRACT,
 TRANSFORM,
 LOAD,
 CHECK_IF_COMPLETE,
 COMPLETE,
 RECUR,
 EXTRACT_ERROR,
 EXTRACT_TIMEOUT,
 LOAD_ERROR,
 LOAD_TIMEOUT,
 MALFORMED_DATA,
 TRANSFORM_ERROR
}

public static final EnumSet<State> ERROR_STATES =
 EnumSet.of(
   EXTRACT_ERROR,
   EXTRACT_TIMEOUT,
   LOAD_ERROR,
   LOAD_TIMEOUT,
   MALFORMED_DATA,
   TRANSFORM_ERROR);

public static final class Stamp {

 public final long timestamp;
 public final State state;

 public Stamp(final long timestamp, final State state) {
   this.timestamp = timestamp;
   this.state = state;
 }

 public Stamp(final State state) {
   this(System.nanoTime(), state);
 }
}
Notice that we’re both defining the full set of states, and then creating a separate EnumSet which calls out the errors. This will be used in later steps.
Step 3: update your passport
In our business logic, we need to make sure we “stamp” our passport with the appropriate state at the appropriate time.
Step 4: generate your metrics
Once we’ve reached the COMPLETE state, we can generate complete metrics for our ETL job. We may not care overly much about the performance of this step, since our example is a batch job, but it is at least possible to do this in a single pass over our stamps:
long extractStart, transformStart, loadStart;

for (Stamp s : stamps) {
  if (ERROR_STATES.contains(s.state)) {
    incrementErrorMetric(s.state.name());
  }

  switch (s.state) {
    case EXTRACT:
      extractStart = s.timestamp;
      break;
    case TRANSFORM:
      updateHistogram("extract", s.timestamp - extractStart);
      transformStart = s.timestamp;
      break;
    case LOAD:
      updateHistogram("transform", s.timestamp - transformStart);
      loadStart = s.timestamp;
      break;
    case CHECK_IF_COMPLETE:
      updateHistogram("load", s.timestamp - loadStart);
      break;
  }
}
This is a relatively simple set of metrics, but it captures the time spent on each portion of our job, over each batch, and all the errors we encountered. If we were feeling more ambitious, we could count the number of retries for our extract and load phases, or the number of batches which were malformed, and so on. Each of these new metrics would add no additional complexity to our codebase, outside of this one function.
Step 5: save your passports
Your stamps can be used to generate dashboard-style metrics, as shown above, but they also can be logged as a single statement, giving us a complete, concise narrative for how the task was performed. This can be significantly simpler to understand than a large number of separate statements describing each individual step. The benefits of this approach are amplified when many such tasks are being performed concurrently, and all the logging statements are interleaved.
We’ve found passports to be a simple, powerful approach to building transparent systems without adding much complexity. Hopefully this provides enough of a roadmap that you can try it out for yourself.
This post was originally on the Fitbit engineering blog, which has since been taken down post-acquisition.